
Trader’s Forge | Strategy Forge Ecosystem
Structure Forge
Identify where liquidity sits, where the market has been, and where price is likely to be drawn next.
Market Structure, Automatically Mapped
Price does not move randomly. It moves toward liquidity. The clusters of stop losses, pending orders, and untested levels that build up at significant swing highs and lows. Understanding where that liquidity sits is one of the most valuable edges a trader can have.
Structure Forge automatically identifies swing highs and lows, Trend Shift and Trend Break labels showing structural reversals and continuations, and the key Fibonacci retracement levels, including the Golden Pocket, derived from significant price swings. It then goes further: clustering nearby highs and lows within a defined percentage range to highlight where liquidity is concentrated, and marking false breakouts to flag liquidity grabs as they happen.
The result is a chart that shows not just where price has been, but why it moved and where it is likely to be drawn next.
In Action
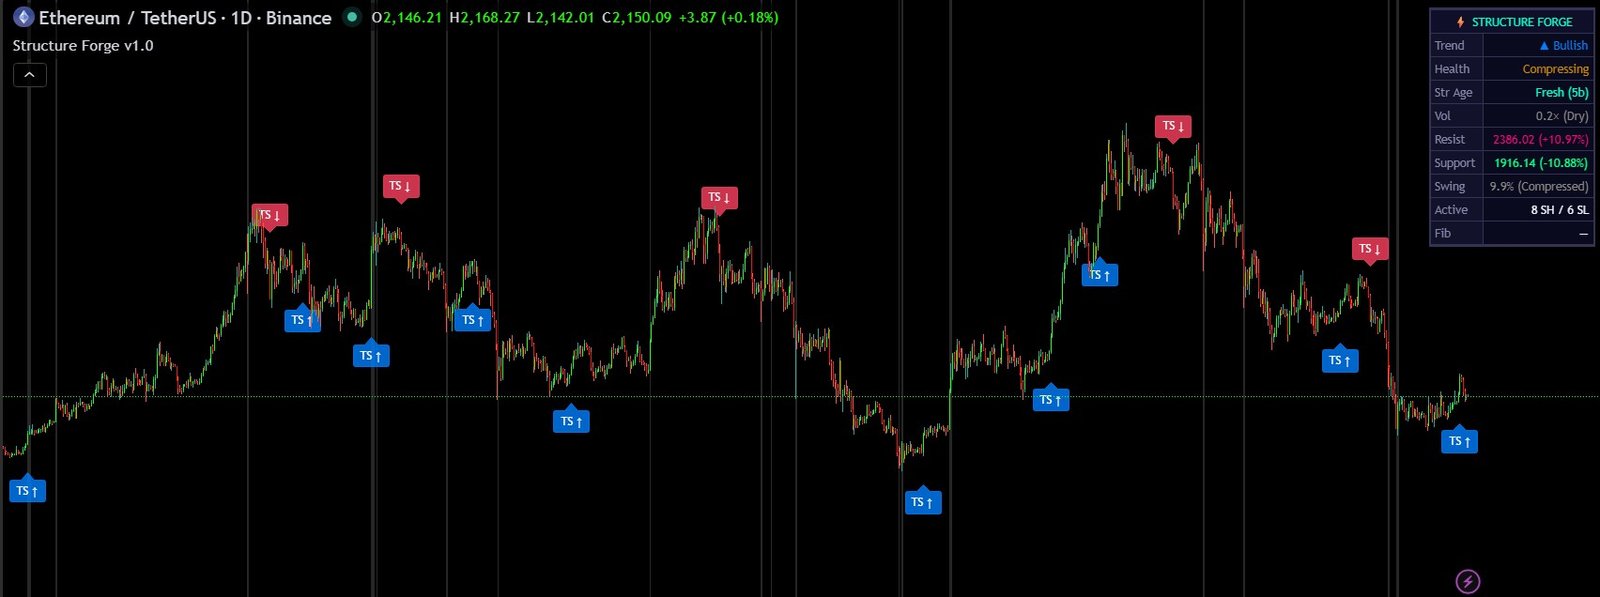
Trend shift labels across a full market cycle
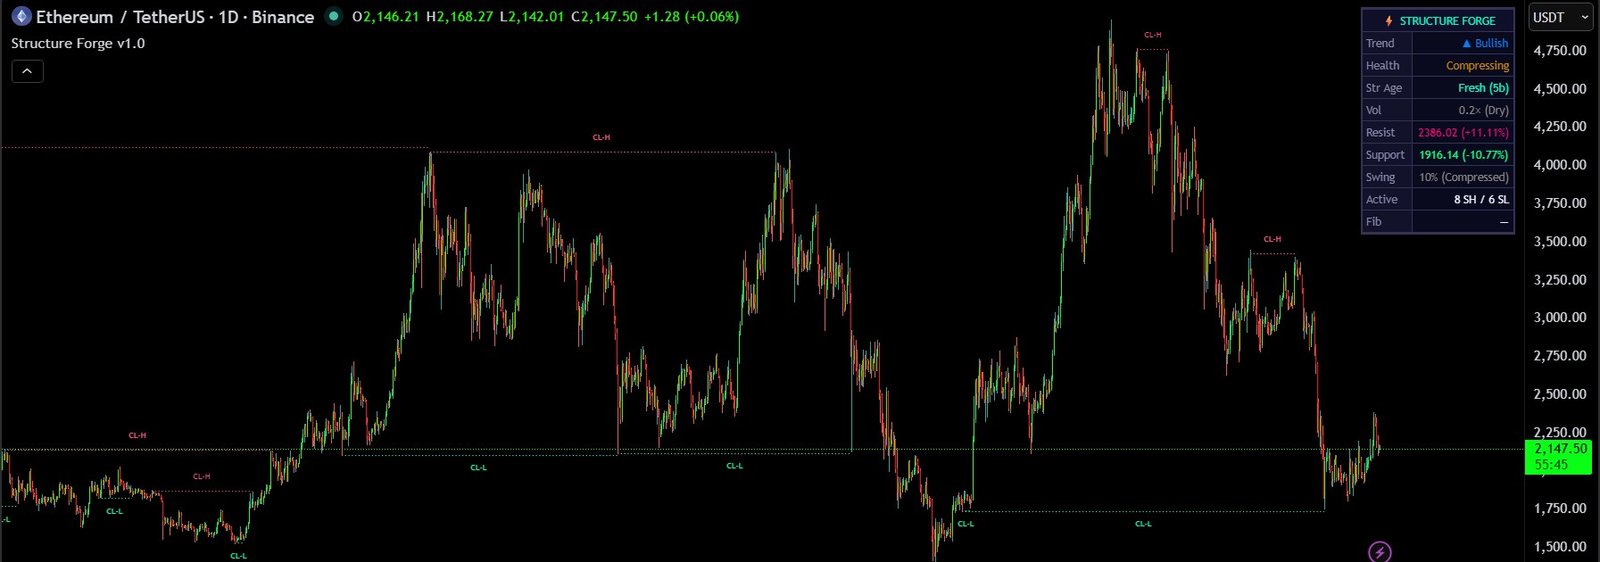
Clustered highs and lows marking liquidity concentration zones
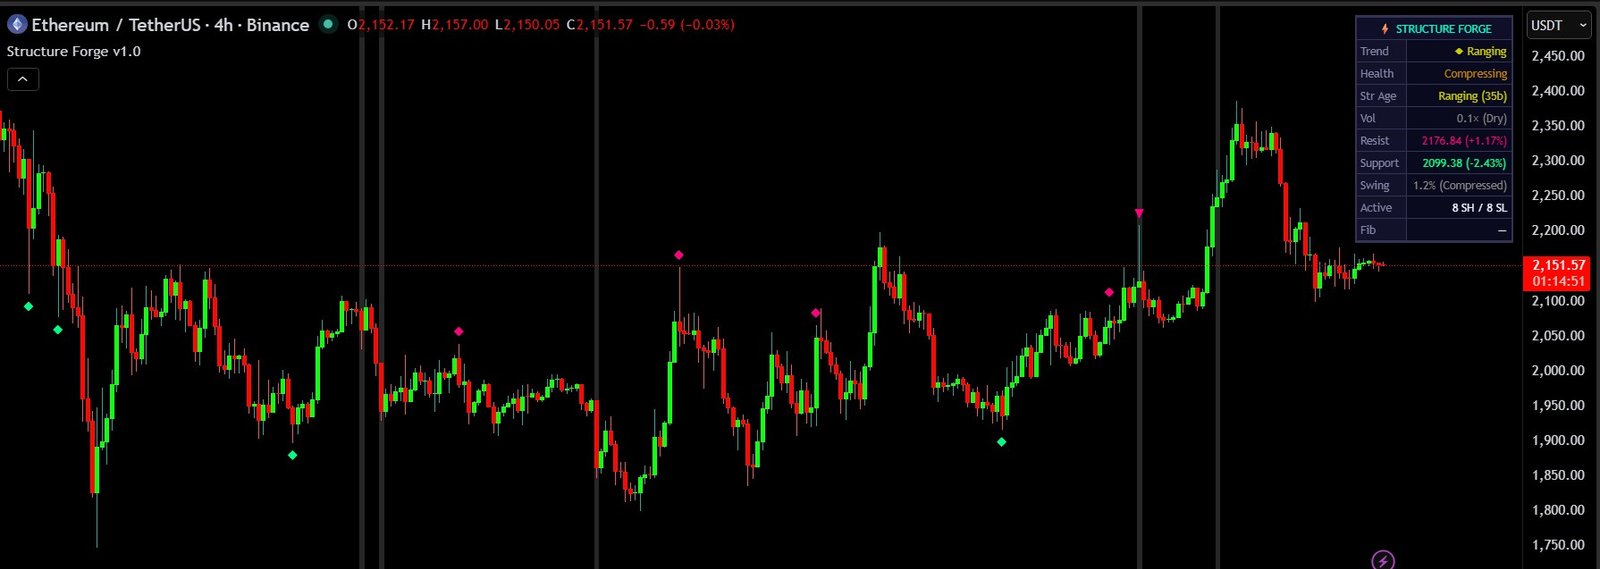
False breakout markers flagging liquidity grabs
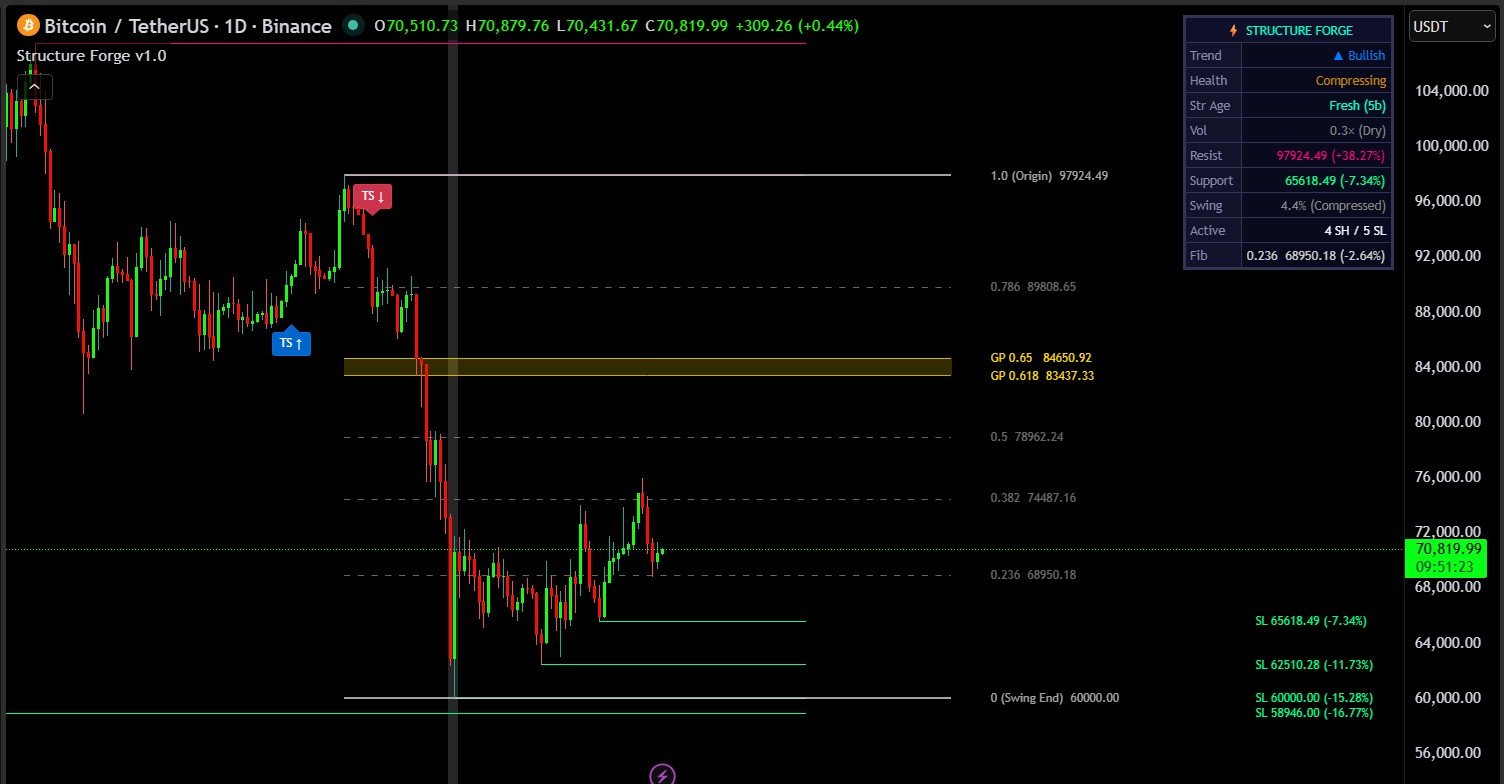
Fibonacci retracement levels and Golden Pocket zone mapped automatically
What You See on the Chart
Swing High and Low Detection
Automatically identifies significant swing points across the chart with SH and SL labels and horizontal lines. An automatic Timeframe Profile adjusts detection sensitivity based on your chart timeframe.
Trend Shift and Trend Break Labels
TS labels mark when structure reverses direction. This is the most actionable structural signal. TB labels mark trend continuation. TS labels are on by default; TB labels are off by default to reduce clutter.
Fibonacci Levels and Golden Pocket
Key retracement levels are automatically drawn from significant swings, including the Golden Pocket (0.618 to 0.65 zone), one of the most consistently respected retracement zones in trending markets. Extension levels at 1.272 and 1.618 are also available.
False Breakout Markers
Diamonds and triangles on bars that wick beyond a swing level but close back inside, a classic liquidity grab pattern. Volume-confirmed false breakouts show as triangles for additional conviction.
Clustered Level Detection
CL-H and CL-L labels where consecutive swing highs or lows sit within a defined percentage of each other. These are magnet zones where price tends to test and break through with force.
Structure Dashboard
A live table showing Trend state, Trend Health, Structure Age, Volume relative to average, nearest Resistance and Support with distance percentage, Swing size status, and the nearest Fibonacci level.
Built to Fit Your Trading Style
Every layer of Structure Forge is independently configurable, from swing detection sensitivity to how Fibonacci levels are displayed.
The automatic Timeframe Profile selects appropriate settings for your chart timeframe out of the box, with named presets for Scalping, Intraday, Swing, and Position trading. A full Custom mode lets you control lookback bars, clustering percentage, minimum swing size, and ranging threshold directly. Toggle Trend Shift and Trend Break labels independently, control which Fibonacci levels display, set your own clustering percentage for grouped levels, and choose whether false breakout markers require volume confirmation. Dashboard position, label styles, and line colours are all adjustable.
Structure Forge is built to give you the information you need without cluttering the chart with what you do not.
Video Walkthrough
The walkthrough below covers swing detection, how to read clustered levels, interpreting false breakout markers, and using the Fibonacci levels in a live swing trading context.