
Trader’s Forge | Strategy Forge Ecosystem
Confluence Forge
Institutional-grade levels, automatically mapped. Trade the zones that actually matter.
The Levels the Market Respects
Drawing support and resistance manually is time-consuming, subjective, and inconsistent. Different traders looking at the same chart will draw different levels. Most of those levels are drawn from the timeframe they happen to be on, missing the bigger picture entirely.
Confluence Forge takes a different approach. It automatically maps where institutional-grade Fibonacci pivot levels, key EMAs, significant open and close levels, and anchored VWAPs align across monthly, quarterly, and yearly timeframes. Where multiple layers converge in the same area, the indicator highlights a confluence zone, a level with genuine weight behind it, drawn from the timeframes where institutional money actually operates.
The result is a cleaner chart, with fewer but more meaningful levels. No manual work. No subjective interpretation. Just the zones the market is most likely to respect.
In Action
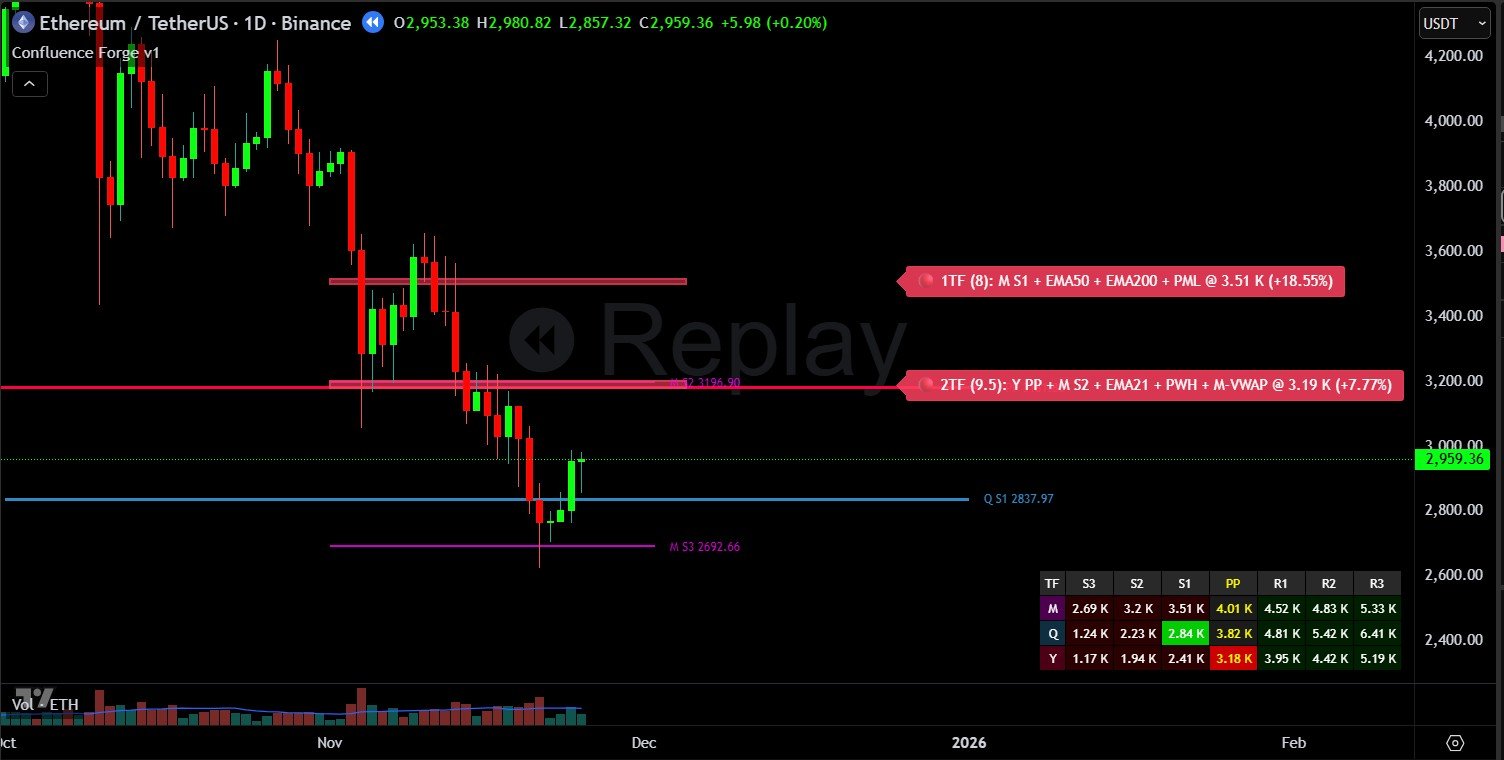
Confluence zones with score labels and layer breakdown
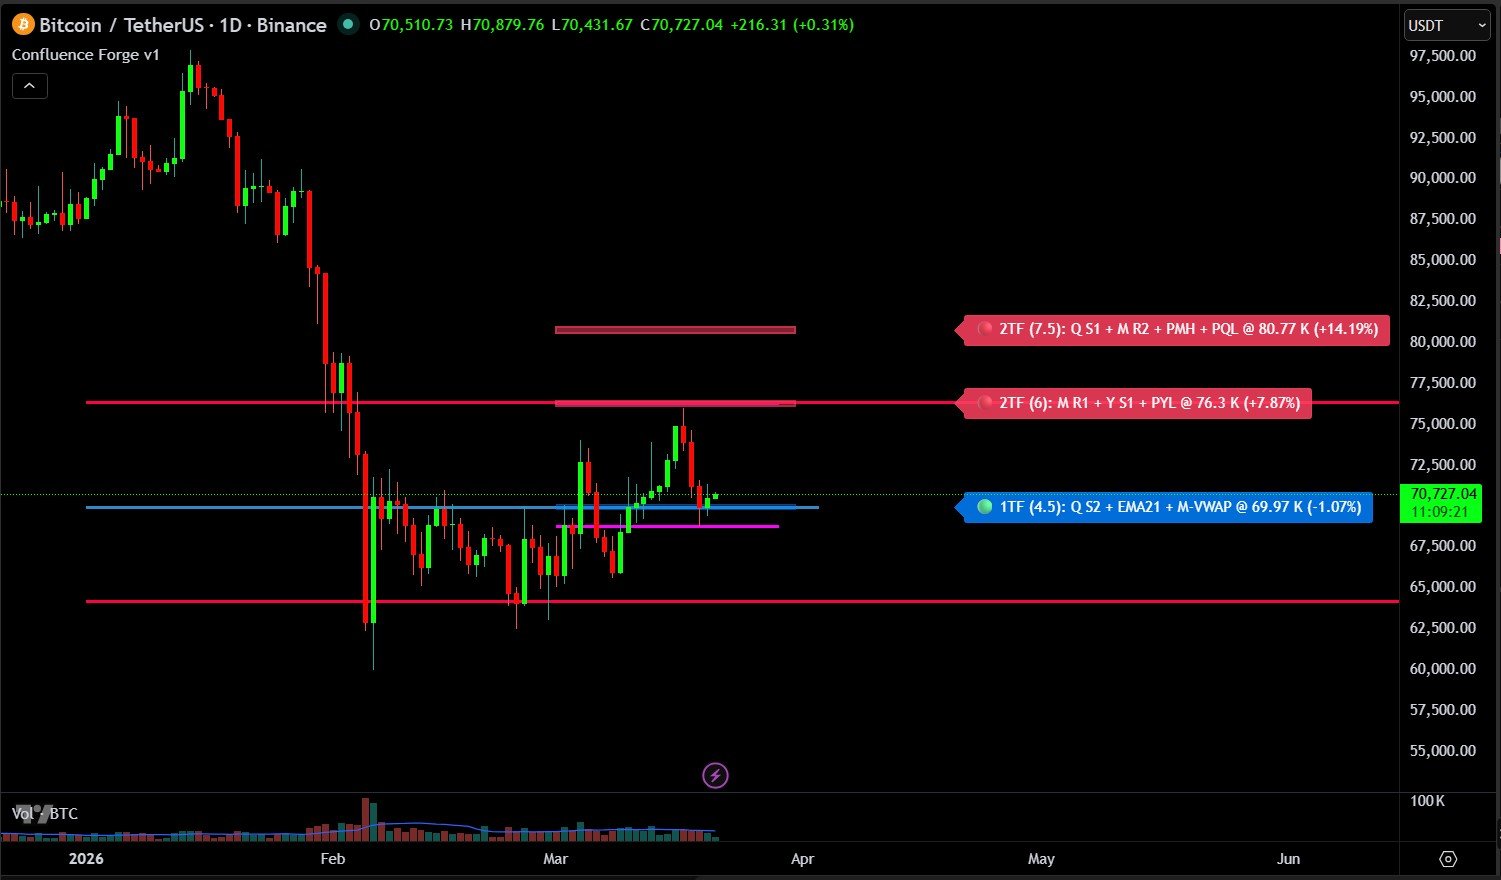
Zones framing key support and resistance levels
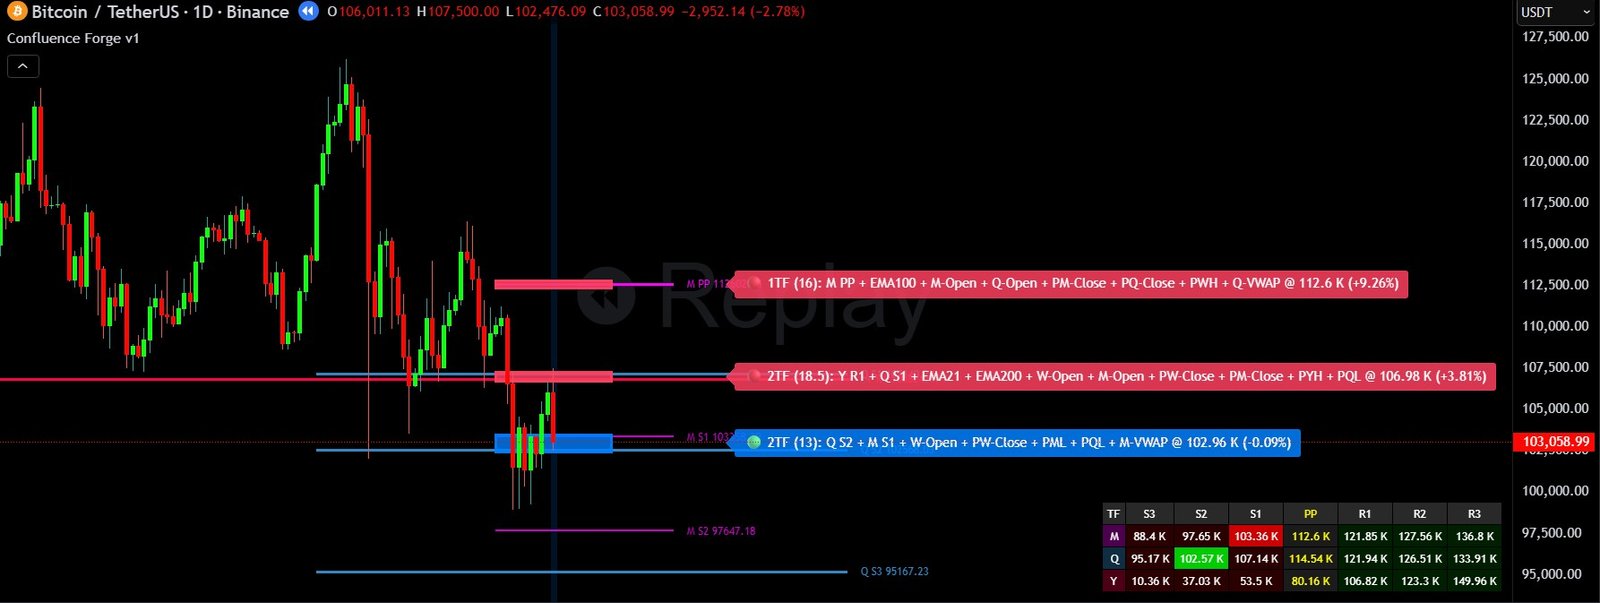
Multiple layers converging into high-score zones
What You See on the Chart
Institutional-Grade Fibonacci Pivot Levels
Automatically calculated from monthly, quarterly, and yearly data. These are the timeframes that institutional participants reference, not just the timeframe you are trading on.
EMA Alignment Detection
Identifies where key moving averages converge with other level types, adding weight to zones that already have multiple factors behind them. Supports up to 7 chart EMAs and 4 higher timeframe EMAs.
Significant Open and Close Levels
Marks the open and close prices of significant periods: weekly, monthly, quarterly, and yearly. Levels that often act as magnets for price and are widely referenced by professional traders.
Anchored VWAP Integration
Brings volume-weighted average price data into the confluence picture across weekly, monthly, quarterly, and yearly anchors, adding a layer that reflects where the majority of trading activity has taken place.
Automatic Zone Highlighting
When multiple level types converge within a defined range, Confluence Forge automatically highlights the area as a confluence zone. Zone opacity adjusts based on confluence score. Stronger zones appear more solid.
Recurring Zone Detection
Zones that existed in the previous period are marked with a star. Recurring zones have proven historical significance and often provide stronger support and resistance.
Zone Edge Lines and Pivot Table
Optional thin lines at the top and bottom boundaries of each zone with price labels, useful for setting precise entries and stop losses at zone edges. A full pivot table displays all active levels across monthly, quarterly, and yearly timeframes with nearest support and resistance highlighted.
Built to Fit Your Trading Style
Every layer of Confluence Forge is independently configurable, from the levels that contribute to a zone to how those zones are displayed.
Choose which timeframes contribute to confluence zones and how much weight each level type carries. Set your own grouping tolerance to suit different markets and volatility regimes. Control how many zones display, from a single nearest support and resistance to a full extended view. Toggle individual Fibonacci levels, EMA periods, VWAP anchors, and period reference levels on or off. Adjust colours, line styles, label formats, and table position to match your chart setup.
A Minimal Mode strips everything back to show only confluence zones when you want a clean chart. Relevant Levels Only filters out everything beyond a set distance from price. The indicator adapts to how you trade.
Video Walkthrough
The walkthrough below covers how the indicator maps levels, how confluence zones are formed, and how to read them in the context of a swing trade setup.
Confluence Forge is one part of a three-indicator ecosystem.
See How They Work TogetherView Pricing