
Trader’s Forge | Strategy Forge Ecosystem
Momentum Forge
Read market energy across four timeframes and catch momentum shifts before they fully develop.
Multi-Timeframe Momentum, Simplified
Most momentum indicators work on a single timeframe. They tell you what’s happening now, on the chart you’re looking at. Momentum Forge works differently.
By reading market energy across four timeframes simultaneously and combining volatility, momentum, and directional components into a single composite line, the Master Line, Momentum Forge gives you a picture of what the market is doing at multiple levels of resolution, all without switching charts or running manual multi-timeframe analysis.
The Master Line is the core of the indicator. Rather than juggling separate readings for volatility, trend direction, and momentum strength, Momentum Forge synthesises them into one output that reflects the true state of market energy at any given moment. When conditions align across components, the signal is stronger. When they diverge, the indicator reflects that uncertainty.
In Action
Master Line and Early Line diverging ahead of a significant move
Zone reversal signals as momentum shifts in overbought and oversold zones
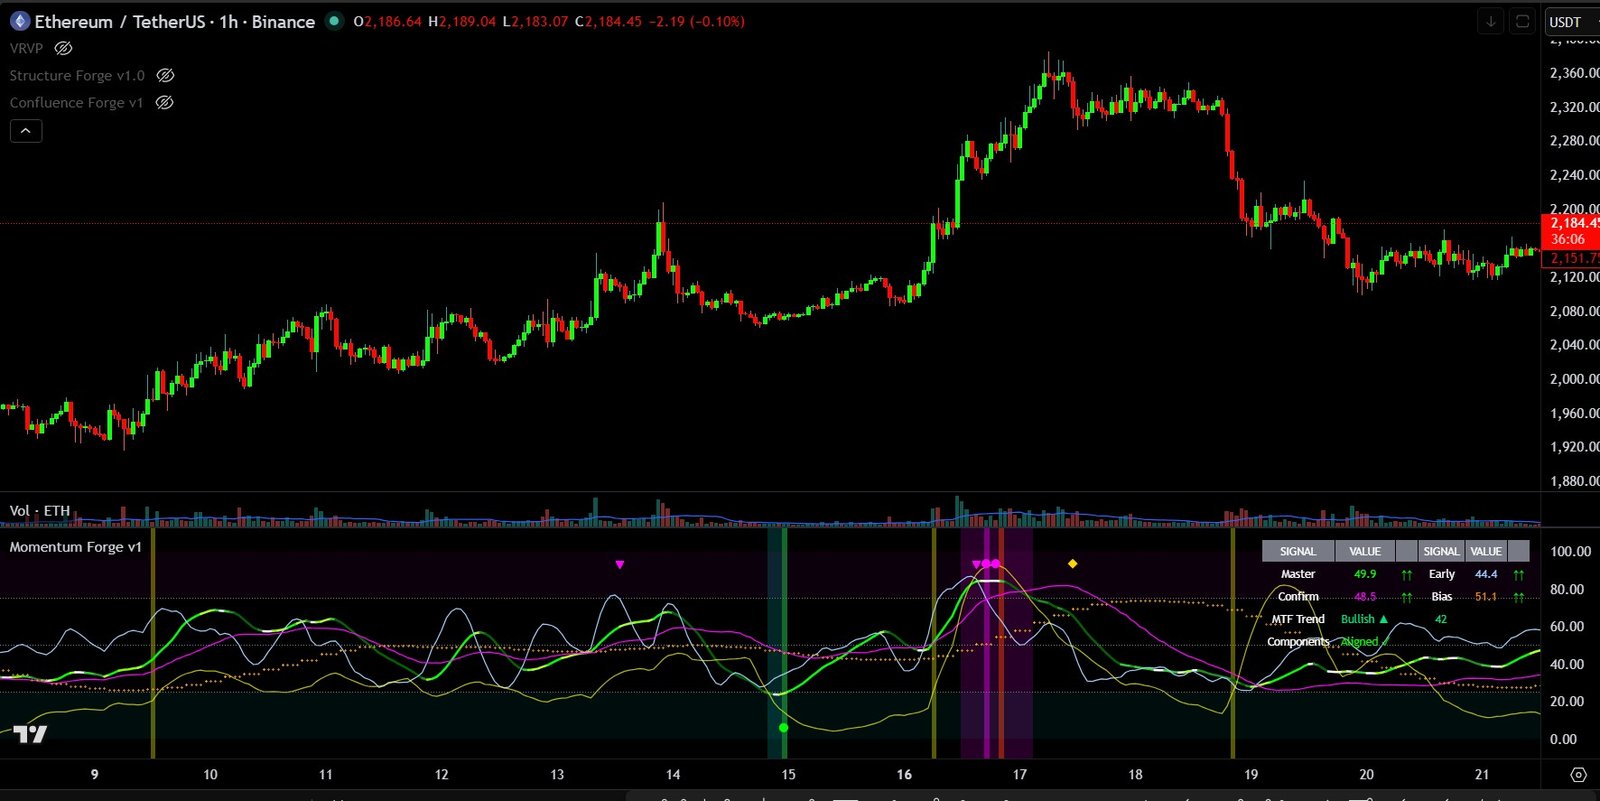
Volatility expansion ahead of a strong directional move
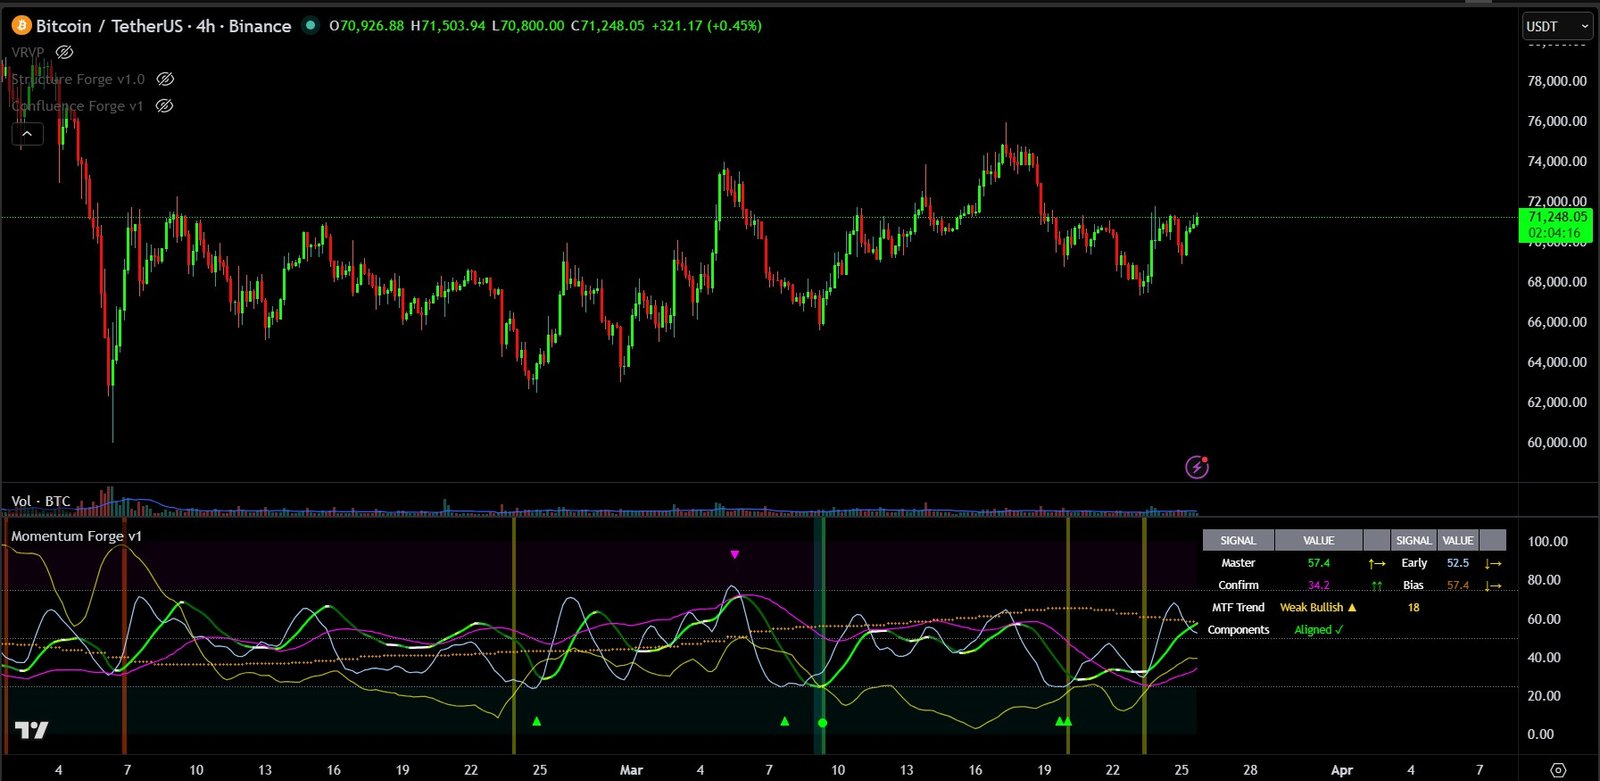
What You See on the Chart
Master Line
A single composite line combining volatility, momentum, and directional data across four timeframes. Cuts through the noise of monitoring multiple indicators across multiple charts.
Early Line
A faster-moving line that provides early warning of momentum shifts before they develop in the Master Line, typically 2 to 5 bars ahead. Triggers Early Warning zone reversal signals when its slope first reverses while still in the overbought or oversold zone.
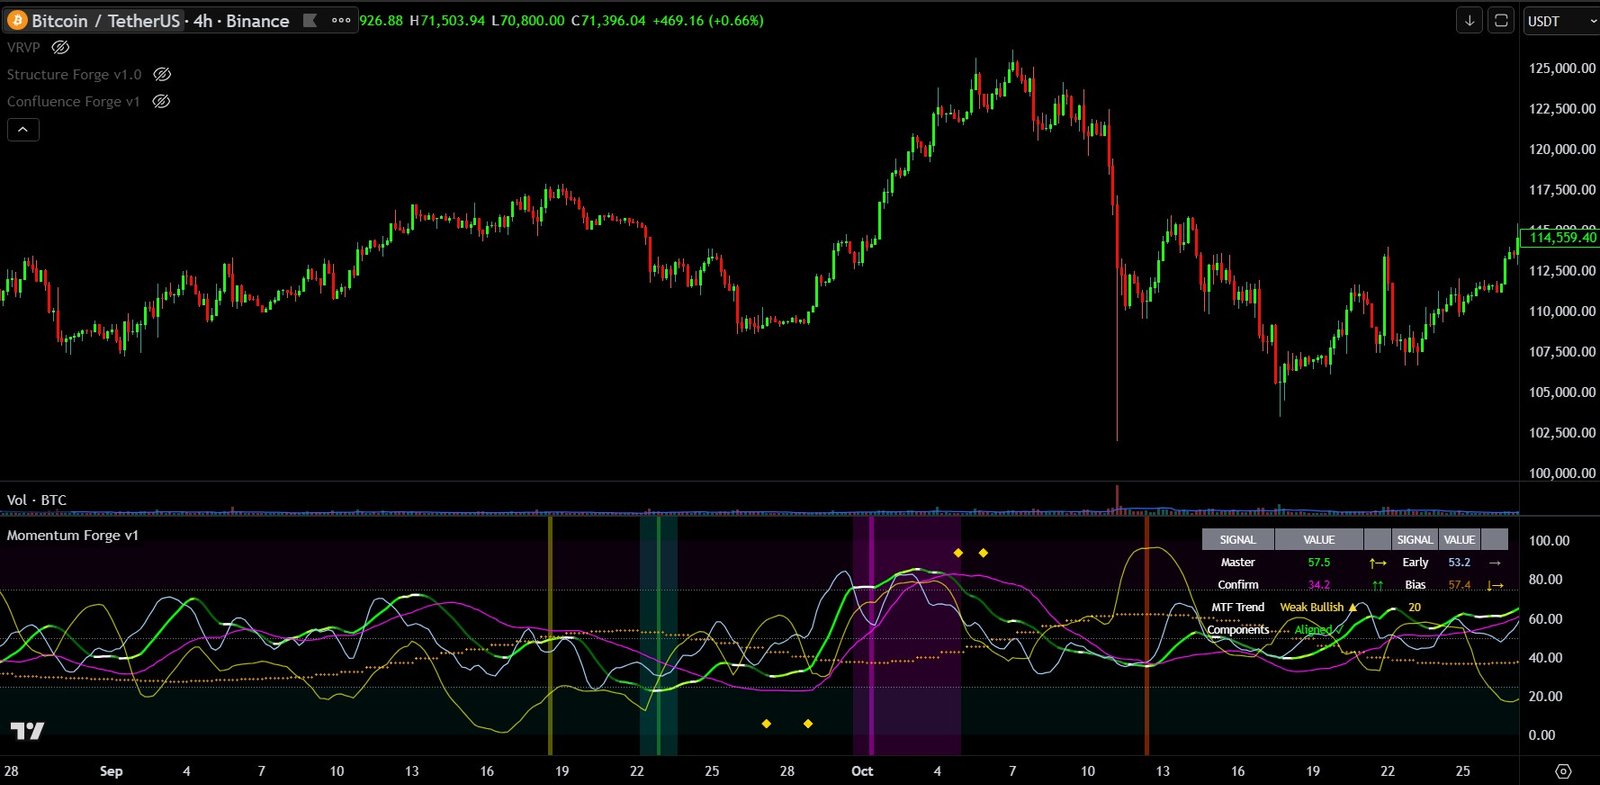
Confirmation Line
A slower confirmation layer. When the Confirmation Line’s slope reverses in a zone, it fires the most reliable signal in the three-tier hierarchy. Gold diamond markers on the chart.
Bias Line
A higher timeframe context line showing the broader directional bias. Crosses style for visual distinction.
Volatility Breakout Detection
Identifies when volatility breaks out after extended compression, shown as yellow bars on the chart. Rare, high-quality signals that indicate a significant move may be starting.
Volatility Exhaustion Detection
Orange bars when volatility retraces from extreme levels. Warning that consolidation or a slow grind is likely.
MTF Trend Strength Dashboard
A live table showing Master, Early, Confirmation, and Bias Line values with directional arrows, MTF Trend Strength score, and Component Divergence status.
Built to Fit Your Trading Style
No two traders work the same way, and no two markets behave identically. Momentum Forge gives you meaningful control over how it behaves so it works for your style, your market, and your timeframe.
Adjust Early Line and Confirmation Line sensitivity to suit faster or slower timeframes. Set your own overbought and oversold thresholds for the asset you trade. Configure volatility breakout and exhaustion detection to match different volatility regimes. Choose whether signals fire on bar close or live. Every line, signal, and table element can be shown or hidden independently. Colours, transparency, and table position are all adjustable too.
Most indicators give you little more than on and off. Momentum Forge is built to adapt.
Video Walkthrough
The walkthrough below covers how to read the Master Line, interpret zone reversal signals, and use the volatility breakout detection in a live chart context.